
Prestressing
Define prestressing tendons, compute losses, check transfer and service stresses, and verify ultimate capacity for prestressed and post-tensioned concrete sections.
Overview
Prestressing applies a compressive force to the concrete before service loads act, offsetting the tensile stresses that would otherwise cause cracking. ACS supports both pretensioned (bonded) and post-tensioned (bonded or unbonded) sections.
The prestressing workflow in ACS has three analysis stages:
- Losses — compute how much of the initial jacking force is lost over time
- Transfer and service stresses — verify concrete stresses remain within allowable limits at two critical stages
- Ultimate capacity — check the moment capacity of the prestressed section at ULS
All three analyses run automatically once you define tendons and the section has valid geometry and materials.
When to use prestressing analysis
Use the prestressing features when designing:
- Precast pretensioned members (hollowcore slabs, bridge girders, prestressed piles)
- Post-tensioned beams or slabs with bonded or unbonded tendons
- Members where crack control under service loads is critical (water-retaining structures, long-span floors)
Defining tendons
Open the PT tab in the right panel to add and configure prestressing tendons.
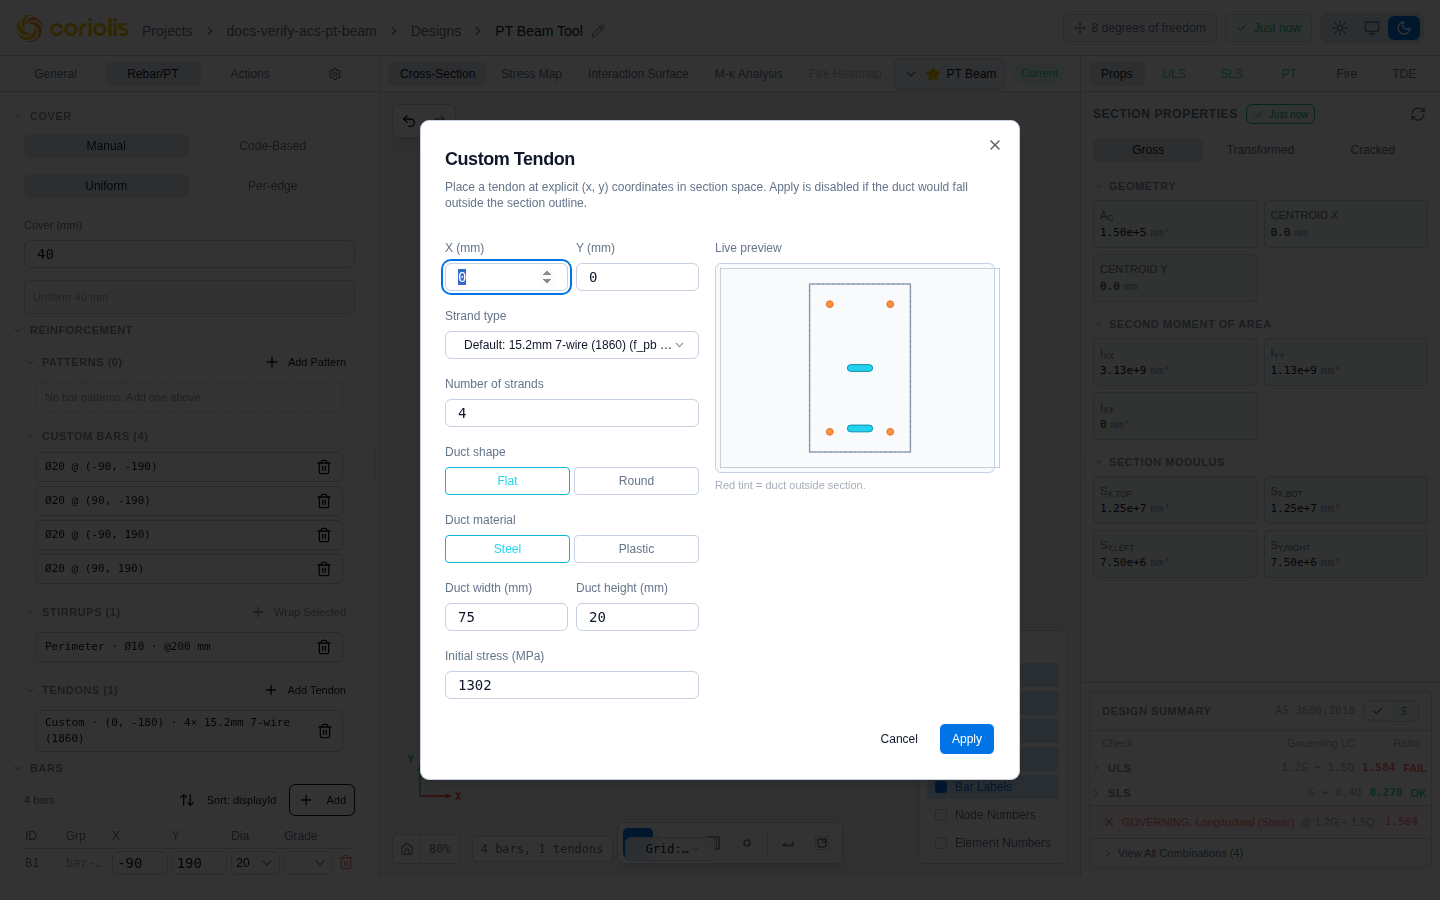
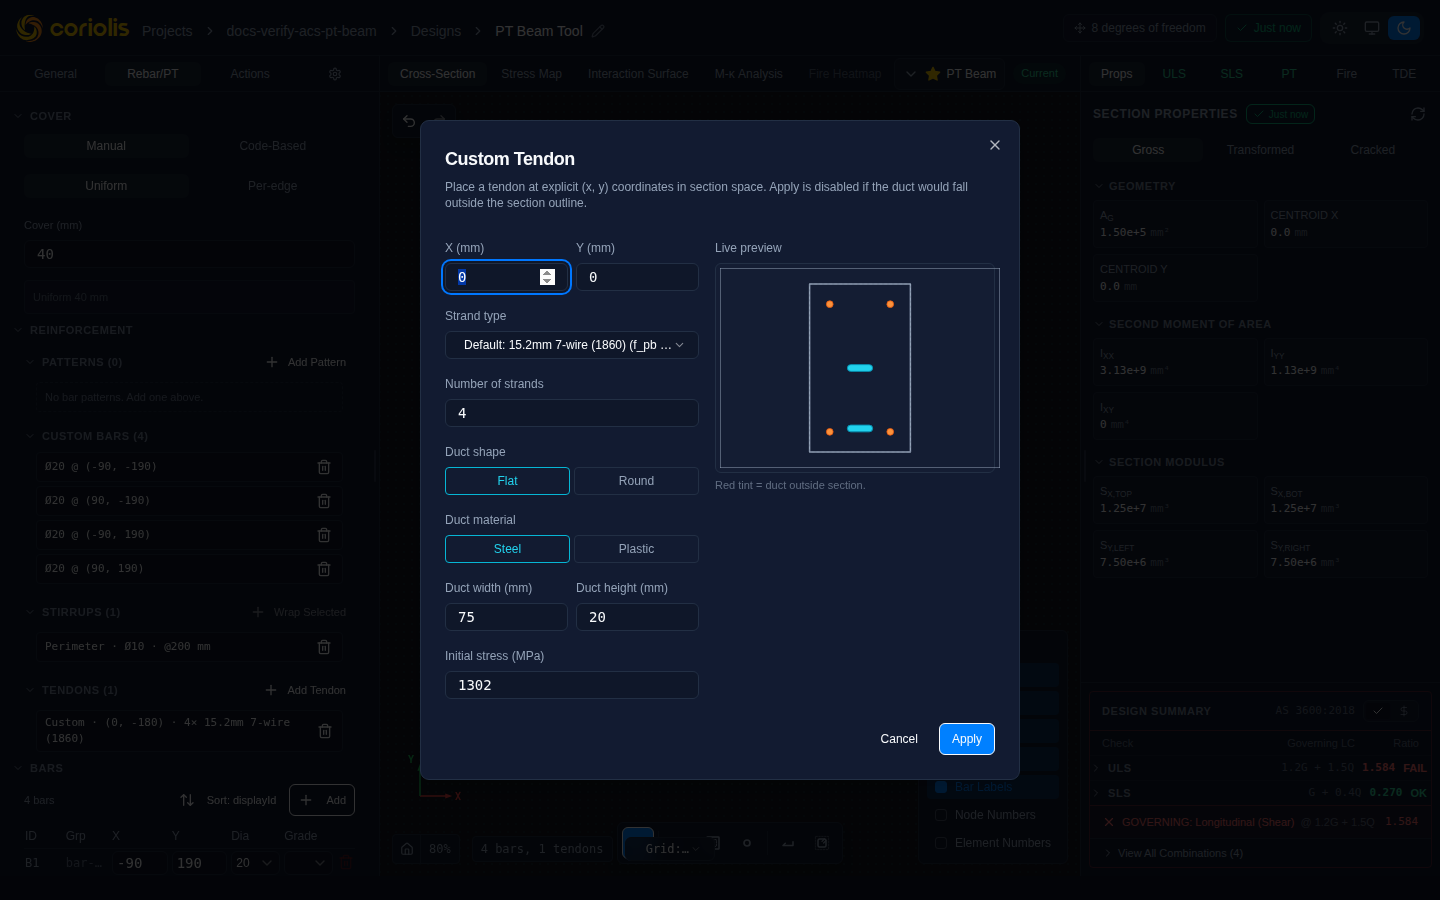
Adding a tendon
Click Add Tendon to insert a new tendon. Each tendon requires:
| Input | Description | Units | Notes |
|---|---|---|---|
| X, Y | Tendon centroid position | mm | Measured from section origin |
| Strand type | 7-wire strand designation | — | See strand library below |
| Number of strands | Strands bundled in the tendon | — | Typically 1—31 per tendon |
| Duct shape | Round (circular) or flat (stadium profile) | — | Flat limited to ≤ 5 strands; see below |
| Duct dimensions | Diameter (round) or width × height (flat) | mm | Width ≥ height for flat ducts; used for friction loss and shear checks |
| Initial stress | Jacking stress | MPa | Typically 0.75—0.85 |
| Bond type | Bonded or unbonded | — | Affects strain compatibility at ultimate |
Duct shape
Each tendon duct can be specified as either a round (circular) or flat (stadium-profile) cross-section.
| Shape | Profile | Strand count | Inputs |
|---|---|---|---|
| Round | Circular | Any | Duct diameter (mm) |
| Flat | Rectangle with semicircular ends | 1–5 strands | Duct width × height (mm); width ≥ height |
Select the duct shape in the tendon editor. When Standard sizing mode is active, ACS automatically suggests dimensions from the duct catalogue: flat ducts for 1–5 strands, round ducts for 6 or more. Switch to Custom to enter exact dimensions.
The flat duct profile is common in post-tensioned slabs where multiple strands are grouped side-by-side in a shallow band. The width and height of the flat duct feed the AS 3600 Cl. 8.2.1.5 effective web width () deduction used in shear checks — the full flat-duct width is deducted from rather than a single circular diameter.
Strand library
ACS provides standard 7-wire low-relaxation strand types for AS 3600 design:
| Strand | Diameter (mm) | Area per strand (mm²) | (MPa) | (MPa) | (MPa) |
|---|---|---|---|---|---|
| 12.7 mm 7-wire (0.5”) | 12.7 | 98.6 | 1860 | 1525 | 195,000 |
| 15.2 mm 7-wire (0.6”) | 15.2 | 140 | 1860 | 1525 | 195,000 |
| 15.7 mm 7-wire super | 15.7 | 150 | 1860 | 1525 | 195,000 |
| 12.7 mm 7-wire 1720 grade | 12.7 | 98.6 | 1720 | 1410 | 195,000 |
| 15.2 mm 7-wire 1720 grade | 15.2 | 140 | 1720 | 1410 | 195,000 |
Strand configuration
Every strand in the library above is 7-wire ordinary construction — one centre wire with six laid around it. ACS records that configuration on the strand product rather than assuming it, so the design checks that depend on the wire count read it from the product you selected.
This matters for one check in particular. The EN 1992-1-1 equivalent tendon diameter — used in crack control — is defined per wire count: for 7-wire strand against for 3-wire (Cl. 6.8.2). It is a different quantity from the strand/wire/bar product form that drives the fire axis-distance increase of AS 3600 Cl. 5.3.3, even though both describe “what kind of tendon this is”.
Where a standard establishes no value for a product, ACS refuses the affected check rather than substituting a similar one. Compacted 7-wire strand is the case that arises: it is drawn through a die after stranding, which deforms the wires out of round, so Cl. 6.8.2’s “wire diameter” is undefined for it and crack control reports why instead of returning an approximate crack width.
Strand yield stress
In the absence of manufacturer test data, the yield strength of all grades of prestressing strand is taken as:
per AS 3600:2018 Cl. 3.3.1(b)(iii). For 1860 MPa strand this gives MPa; for 1720 MPa strand MPa.
The yield stress caps the tendon stress at ultimate (), which is conservative for strain-hardening strand where lies below the actual 0.1% proof stress. If you have certified test data showing a higher yield stress, contact support to use a custom strand type.
Concrete strength at transfer ()
Set the concrete strength at transfer in the f’ci field below the tendon table. This is the compressive strength of the concrete at the time the prestress is applied — typically 0.75—0.85 for pretensioned members and may be lower for early-age transfer.
Prestress losses
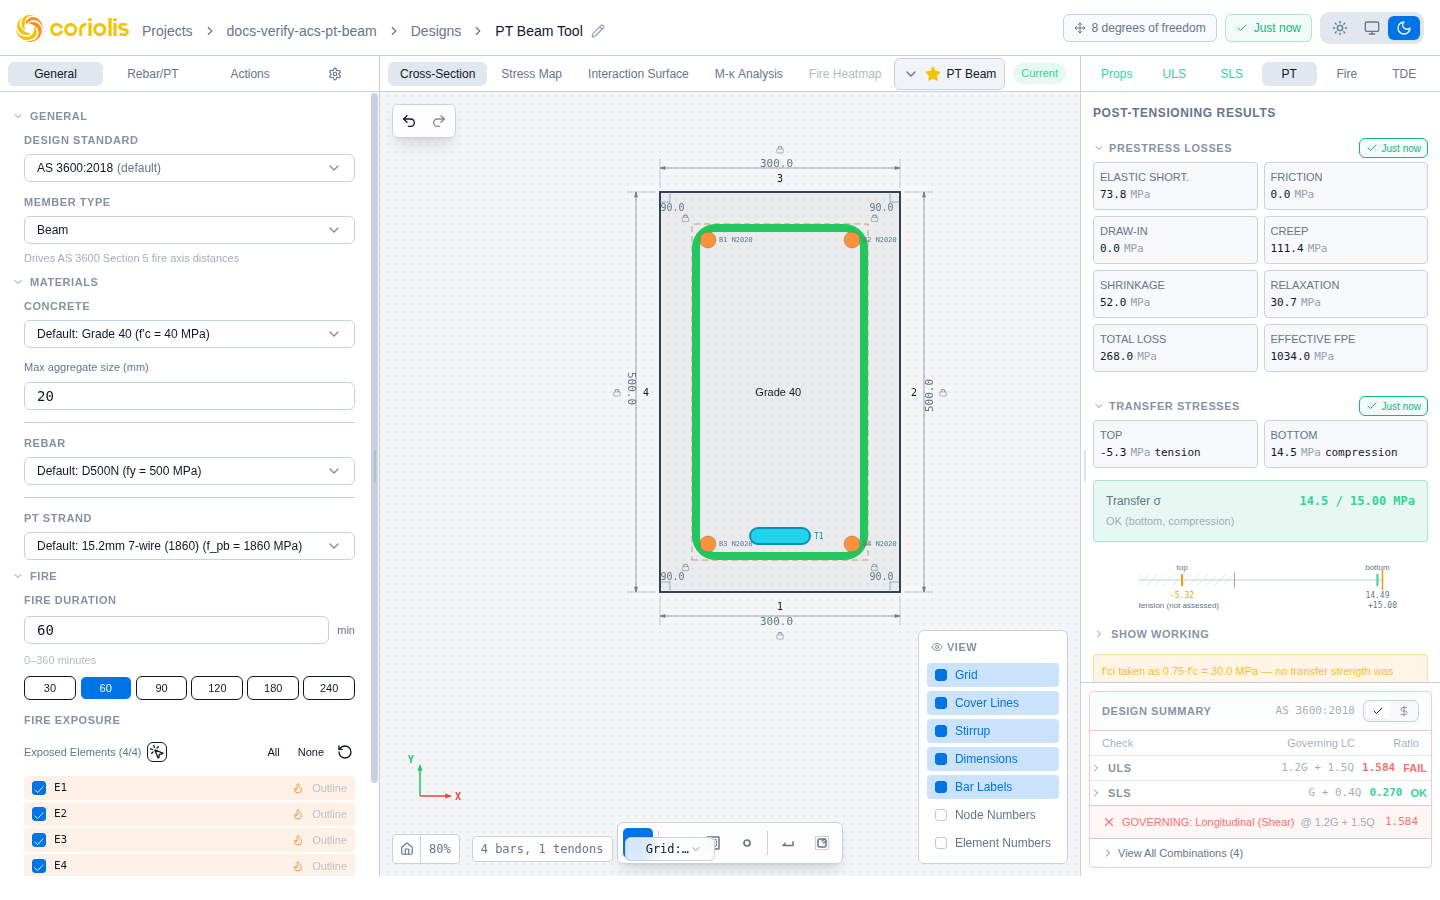
Prestress losses reduce the initial jacking stress to the effective prestress over time. ACS computes each loss component individually and displays them in a breakdown table.
Immediate losses
| Loss type | Cause | Reference |
|---|---|---|
| Elastic shortening | Concrete deforms elastically under the initial prestress force | AS 3600 Cl. 3.4.3.3 |
| Friction (PT only) | Tendon rubs against the duct wall along its curved profile | AS 3600 Cl. 3.4.2.4 |
| Anchorage draw-in (PT only) | Tendon slips back during anchorage seating (typically 5—6 mm) | AS 3600 Cl. 3.4.3.2 |
Friction loss formula
The friction loss along the duct depends on the design code:
Where:
- = jacking stress (MPa)
- = friction coefficient between tendon and duct (default 0.20 for flat duct, per AS 3600 Table 3.4.2.4)
- = cumulative angular change from the jack to the section (rad)
- (AS/EN) / (ACI) = wobble coefficient per unit length of duct (default rad/mm = 0.008 rad/m, the AS 3600 lower bound)
- = length of duct from the jack to the section (mm)
AS 3600 and EN 1992-1-1 treat wobble inside the friction coefficient: the exponent is . ACI 318 treats wobble as a separate additive term: the exponent is . ACS automatically selects the correct form based on the design code.
Long-term losses
| Loss type | Cause | Reference |
|---|---|---|
| Creep | Concrete undergoes time-dependent deformation under sustained prestress | AS 3600 Cl. 3.1.8 |
| Shrinkage | Concrete volume change as moisture evaporates | AS 3600 Cl. 3.1.7 |
| Relaxation | Stress in the tendon reduces over time at constant strain | EN 1992-1-1 Cl. 3.3.2(6) |
Relaxation class
The relaxation loss depends on the class of the prestressing steel. EN 1992-1-1 Cl. 3.3.2(4)P defines three, and ACS charges the value Cl. 3.3.2(6) gives for each — the relaxation loss at 1000 hours and 20 °C, as a percentage of the initial stress:
| Class | Steel | |
|---|---|---|
| Class 1 | Wire or strand, ordinary relaxation | 8% |
| Class 2 | Wire or strand, low relaxation | 2.5% |
| Class 3 | Hot rolled and processed bars | 4% |
The class comes from the tendon grade you select. Every strand grade in the standard catalogue is EN 10138-3 product and is therefore Class 2: Cl. 3.3.2(4)P notes that Class 1 is not covered by EN 10138, and Class 3 is bar rather than strand.
If the selected grade does not declare a class, ACS assumes Class 2 and says so in the loss results rather than assuming it silently — the difference matters, because Class 1 steel relaxes more than three times as much and an unstated assumption in that direction over-states the effective prestress.
Loss results
The loss panel reports:
| Output | Description |
|---|---|
| Each loss component | Individual loss in MPa and as a percentage of |
| Total immediate loss | Sum of elastic shortening + friction + draw-in |
| Total long-term loss | Sum of creep + shrinkage + relaxation |
| Total loss | All components combined |
| Effective prestress | minus total loss |
| Loss percentage | Total loss as percentage of initial stress |
Typical total losses range from 15—25% of the initial jacking stress, depending on the member geometry, concrete properties, and loading history.
PT-aware time-dependent analysis (AEMM)
When prestressing tendons are defined, the time-dependent effects panel runs the Age-Adjusted Effective Modulus Method (AEMM) with the at-transfer prestress as the initial concrete stress state. The AEMM then computes creep, shrinkage, and relaxation increments that develop on top of that initial state — the same three effects that drive long-term prestress losses.
Bonded tendons are included in the transformed cross-section at both the short-term modular ratio and the long-term ratio . Unbonded tendons contribute the prestress force only (no local stiffness, since the tendon is free to slide within the duct).
Tendon stress-loss output
The Effective Stiffness results table gains a Δσ_p (MPa) column for PT sections, reporting the time-dependent tendon stress loss at each analysis age. This column is hidden for reinforced sections and appears automatically when any tendon is present.
| Output | Appears for | Description |
|---|---|---|
| Creep coefficient | RC and PT | Long-term creep multiplier at each age |
| Shrinkage strain | RC and PT | Drying + autogenous strain at each age |
| Effective modulus | RC and PT | Age-adjusted modulus at each age |
| (MPa) | PT only | Tendon stress loss from creep + shrinkage + relaxation |
Warnings
An amber warning banner appears when:
- Unbonded tendon approximation — the AEMM seeds the initial stress state from an area-weighted average effective prestress across all unbonded tendons. This approximation is stated explicitly so you can judge whether it is acceptable for your geometry.
- High at-transfer stress () — the AS 3600 creep model is calibrated for stresses up to half the 28-day characteristic strength; results above this level should be treated as indicative.
Transfer and service stresses
ACS checks concrete stresses at two critical stages:
At transfer
Immediately after the prestress force is applied. At this point:
- Concrete has only reached its transfer strength
- A coexisting moment acts alongside the eccentric prestress
- Both top and bottom fibre stresses must be within allowable limits
Entering the transfer-stage moment. is an input on the PT panel, not something ACS derives. Deriving it from a span would require a load pattern, a support condition and a critical-section choice that belong to a member-level tool, so ACS receives the moment the same way it receives the service-stage and . It is predominantly self weight, but construction and handling load act on the same term — precast lifting is the canonical reason the transfer check exists.
The value is signed, on the platform convention: positive = sagging (compression at the top face), negative = hogging. The sign is load-bearing, because leaving the moment out is only conservative where it opposes the prestress moment:
| Tendon position | Coexisting moment | Effect of omitting |
|---|---|---|
| Low () | Sagging | Conservative — both faces relieved |
| High () | Hogging | Conservative — both faces relieved |
| Low () | Hogging | Unconservative at both faces at once |
| High () | Sagging | Unconservative at both faces at once |
The two unconservative rows are not contrived: a precast member with a low straight strand pattern lifted at inboard points hogs under its own weight while the strand stays low, and the same holds near an inflexion point on a continuous member.
Leaving the field blank means not supplied, and both the panel’s working table and the report
label the stage as not modelled rather than printing a bare zero. Entering 0 is a different
statement — that the section genuinely carries no coexisting moment, as a PT column under pure
axial prestress does — and is labelled as such.
Where:
- = initial prestress force (after immediate losses)
- = eccentricity of the prestress force from the centroid, positive below the centroid
- , = gross section area and second moment of area
- , = distances from centroid to top and bottom fibres
Sign convention. Concrete stresses are reported with positive = compression, negative = tension — the same convention ACS applies everywhere, including the SLS stress checks and the stress map, and set out in full on the platform sign conventions page. Each stress card in the PT results panel names its own sense (“compression” or “tension”) beside the value, so the sign never has to be inferred. The allowable limits below are unsigned magnitudes: a fibre passes when .
At service
Under long-term sustained loads with the effective prestress (after all losses):
Where , , and the extreme-fibre distances are properties of the transformed section — the composite section with each steel area replaced by an equivalent concrete area using the modular ratio . Measuring from the transformed centroid (rather than the gross centroid) correctly accounts for the neutral-axis shift due to the tendon and reinforcement area. The eccentricity is the distance from the transformed centroid to the tendon resultant.
The effective tendon force and the eccentric prestress moment are both included in every SLS stress check, using the post-loss from the losses panel. ACS evaluates this at all defined load combinations and identifies the governing one.
Allowable stress limits
| Stage | Check | AS 3600 | ACI 318 | EN 1992 |
|---|---|---|---|---|
| Transfer | Compression | 1 | ||
| Transfer | Tension | not assessed 2 | 5 | |
| Service | Compression | 3 | ||
| Service | Tension | or 4 | 5 |
Not every value above is mandated by the standard whose column it sits in. Where ACS applies a limit the standard does not itself codify — or where we have not been able to verify the attribution against the primary text — it is named as an import or as an unsourced platform value, never presented as a clause requirement. The annotations below cover the AS 3600 column and the two ACI tensile values.
-
AS 3600:2018 Cl. 8.1.6.2(b) — the general branch. Cl. 8.1.6.2(a) permits the more generous for a section that is rectangular in cross-section and where the stress distribution is triangular in shape; ACS applies branch (b) to every section, which is the conservative reading. (AS 3600 writes the transfer strength ; the ACS input field labels the same quantity .)
-
Not assessed — AS 3600:2018 codifies no tensile limit at transfer. Cl. 8.1.6.2 is the transfer clause and it addresses compression only. Nor is this an omission in the standard: Cl. 8.1.6.2 is a strength check — “checked using the load combinations specified in Clause 2.5.2.2 and a strength reduction factor () for the section of 0.6” — whose compressive stress limits are a deemed-to-satisfy shortcut, not an allowable-stress envelope. Transfer-stage cracking is instead governed by Cl. 8.1.6.1 () and by the Section 8.6 crack-control clauses under service loads. ACS previously applied here and described it as an imported convention; no source was found to import from — the coefficient appears nowhere in the standard — so it has been removed rather than re-cited. The transfer verdict now reports “compression OK — tension not assessed”, and the transfer tensile stress is still displayed for you to judge.
-
Not codified by AS 3600:2018 as a service stress limit. is the Cl. 3.1.8.4 linear-creep threshold, imported from EN 1992-1-1 Cl. 7.2(3) by analogy under the quasi-permanent combination. The same import, with the same reasoning, governs the RC service stress check.
-
AS 3600:2018 Cl. 8.6.3 — codified, and conditional on your detailing. The clause deems flexural cracking controlled up to outright; the more generous of route (a) applies only where reinforcement or bonded tendons are provided near the tensile face at a centre-to-centre spacing not exceeding 300 mm. ACS now tests that precondition against the section you have drawn: bars and bonded tendons lying in the tension zone are collected, their centre-to-centre spacing is measured perpendicular to the strain gradient, and the tier is applied only if at least one qualifying element is present and no gap exceeds 300 mm. Unbonded tendons carry no bond stress and do not count. Sections without that detailing are measured against — 2.4× stricter. The PT crack-control panel described below tests the full Cl. 8.6.3 ladder, including routes (b) and (c), and reports which route governs.
-
Unsourced — an ACS platform value, not a citation. The two ACI tensile limits are the coefficients ACS applies, but we have not verified them against the primary text of ACI 318-19, which is not in our reference corpus. On review the clause numbers previously shown beside them appear to address compressive stress, and does not match the Class U threshold under any reading available to us. Rather than publish an attribution we cannot stand behind — an engineer reasonably reads a cited clause as the standard’s requirement — the panel labels both as Heuristic and names no clause, and the calculation report states the same beside each limit rather than printing a bare number. The values themselves are unchanged from earlier releases. If you are designing to ACI 318, check these two limits against the standard yourself.
Biaxial bending
The stress field of an uncracked prestressed section is a plane, and ACS solves it in full:
with the two gradients and found from the section’s full inertia tensor:
This matters more often than it looks. Three independent things tilt the neutral axis, and any one of them means there is no single “top fibre stress” — the stress varies along the top face:
- A moment about the y-axis. stresses the left and right fibres, not the top and bottom.
- A tendon group eccentric in . A single-sided cable, a laterally draped one, or a group following a curved soffit applies a prestress moment about the y-axis, whether or not any applied exists.
- A section with a non-zero product of inertia — an L-section, a single-bevelled beam, or any freeform outline without an axis of symmetry aligned to or . Such a section bends biaxially even under a pure .
Where the field is genuinely uniaxial (no , tendons on the centroidal y-axis, ) the expression above reduces exactly to the classical , and the panel reports the top and bottom fibre stresses as before.
Where it is not, ACS reports the section’s peak compression and peak tension instead — each with the corner it was read at — and says which of the three causes applies. It does not report a top- or bottom-fibre value, because on such a section neither is a single number. Because the stress field is a plane and the outline is a polygon, those extremes are located exactly: a plane attains its maximum and minimum on a polygon at vertices, so sweeping the corners is not a sample.
:::note[Signed moment components — results change in 2026-07] The biaxial stress solve uses the signed values of and as they enter the right-hand side of the inertia-tensor system above. Prior to 2026-07, the calculation used scalar magnitudes instead, which produced incorrect results for sections under moments of mixed sense — a sagging combined with a hogging , or vice versa. Sections under single-axis bending are unaffected; sections with combined biaxial loading should be re-checked in the current version. :::
What the results panel shows
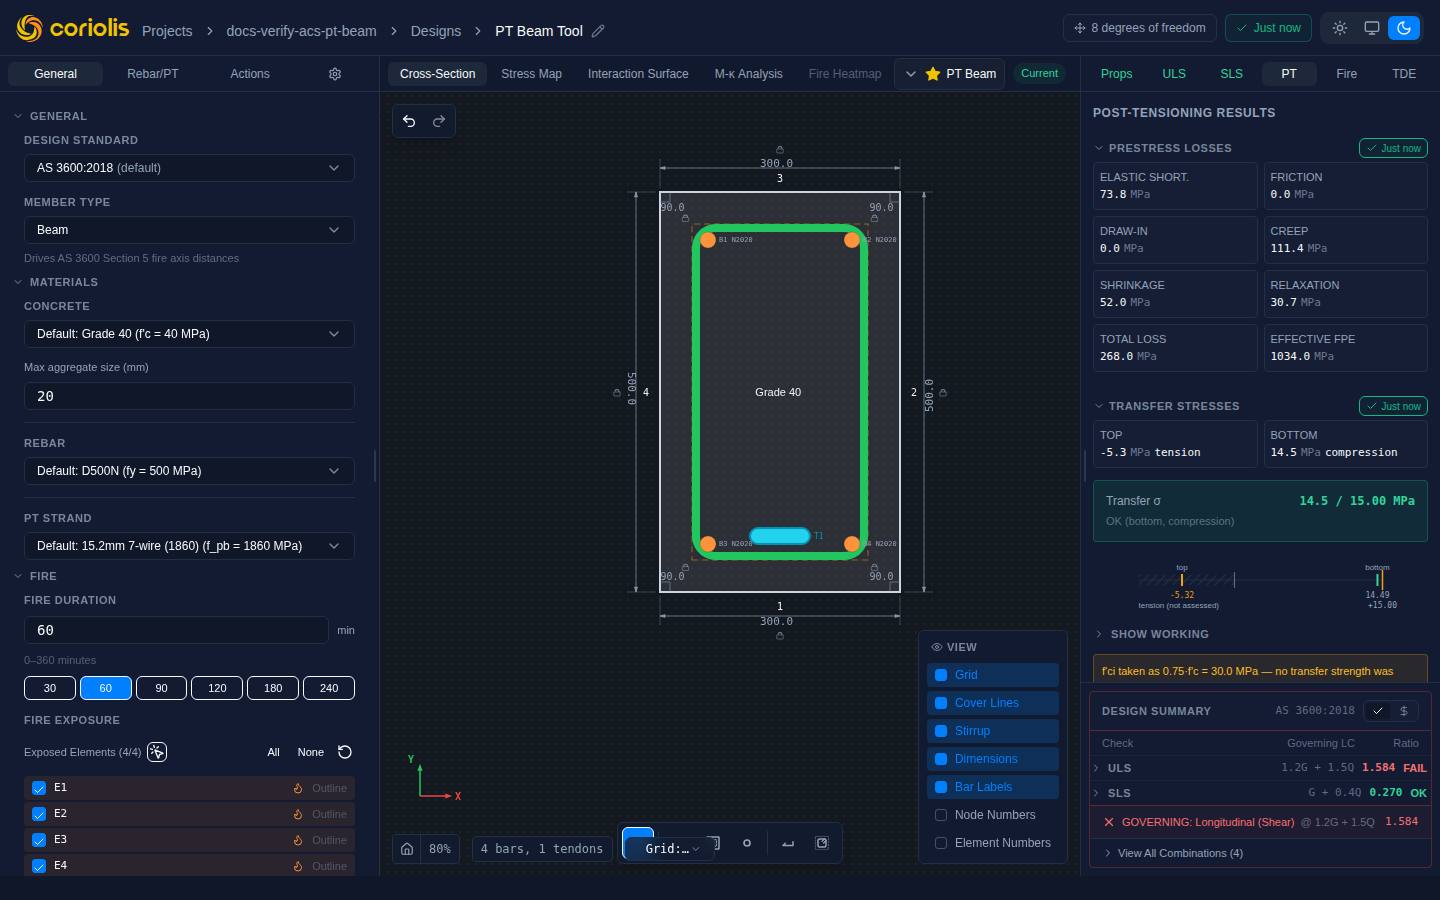
The results panel shows the fibre stresses at both stages with pass/fail status against the applicable limits — the top and bottom faces for a uniaxially-bent section, or the two peak points for a biaxially-bent one (see above). Each stage’s verdict card is accompanied by an expandable disclosure — click it to see the allowable limit, the actual demand, and the reasoning behind the pass or fail. For each stage it also reports:
- The governing comparison — the worse of the peak-compression and peak-tension comparisons, as a value/limit pair with its location (“top” / “bottom”, or a corner such as “upper-left”) and sense (“compression” / “tension”). A PT fibre stress sits inside at two independent extremes, so “the utilisation” is undefined until a rule picks one; the pass/fail verdict remains the engine’s, and this ratio explains it rather than deciding it.
- A stress band placing each reading inside the admissible range. Where a stage has no tensile allowable, the tension side is hatched and labelled not assessed rather than drawn to a bound — nothing in the graphic asserts a limit the standard does not set.
- The term-by-term working behind each stress: , and , plus and where the y-axis participates, which sum exactly to the reported — alongside the , , , , , and they were substituted from. A stage given an but no says so rather than printing a bare zero, on the same footing as the transfer-moment disclosure: an unsupplied moment and a moment asserted to be zero produce identical stresses and mean opposite things.
- Which limit applied, and where it came from. Each allowable is labelled with the sense it governs ( / ) and carries its provenance: the clause where one genuinely mandates the value, the source standard where it is an import by analogy, and Heuristic where it is unsourced. For AS 3600 at service this includes which Cl. 8.6.3 tier your section earned — or the 2.4× stricter — and, when it did not earn the permissive tier, what the detailing would have to be (see note 4).
- A substitution notice when no transfer strength was entered and was taken as . Because the transfer compressive allowable is , that substituted input sets the number your section is measured against, so it is stated beside the limit rather than left implicit.
The same stage tables, verdicts, limits and disclosures appear in the Transfer / Service Stresses section of the generated calculation report, computed from the same inputs by the same kernel — the report cannot show a different governing face, a different allowable or a different verdict than the panel. That includes the biaxial branch: where the panel reports peak points rather than faces, so does the report.
PT cracking moment
The cracking moment for a prestressed section is higher than for an equivalent reinforced section because the applied moment must first overcome the prestress precompression before the tension fibre can crack. Per AS 3600:2018 Cl. 8.5.3.1:
Where:
- = transformed section modulus to the tension fibre (mm³), computed using the transformed gross section (concrete + modular-ratio contributions of reinforcement and tendons)
- = flexural tensile strength of concrete (MPa)
- = shrinkage-induced restraint tensile stress at the tension fibre (MPa, AS 3600 only; zero for EC2 and ACI 318)
- = axial precompression from the applied design axial force (MPa)
- = prestress axial decompression (MPa), where is the total effective prestress force
- = eccentric prestress decompression moment (kN·m), where is the eccentricity of the tendon resultant resolved toward the tension fibre
The physical interpretation: the prestress applies a compressive stress at the tension fibre. Before the section can crack, the applied moment must overcome this precompression and reach the flexural tensile strength .
ACS computes using the post-loss effective prestress — the same value used in the service stress and ultimate capacity checks. The cracking moment is reported in both the SLS results panel and as the cracking point on the moment-curvature curve; both show the same value for the same section.
PT crack control (AS 3600 Cl. 8.6.3)
For sections with prestressing tendons, the Crack Width panel implements the deemed-to-comply ladder of AS 3600:2018 Cl. 8.6.3 rather than the RC direct crack width calculation. The ladder tests four routes in order from least to most onerous; the section passes as soon as any route is satisfied.
Routes and criteria
| Route | Criterion | Notes |
|---|---|---|
| Decompression | Concrete tensile stress at the extreme fibre | |
| Low tensile stress | Bonded crack-control elements required ≤ 300 mm c/c | |
| Steel-stress increment | Table 8.6.3 limit | Stress increment in crack-control steel since decompression |
| Crack width | Full crack width calculation with prestress-aware cracked-section solve |
The name of the satisfied route appears in the results panel alongside the utilisation ratio.
Table 8.6.3 limits (steel-stress increment route)
For the steel-stress increment route, ACS looks up the permissible from AS 3600:2018 Amendment 2:2021 Table 8.6.3 based on the governing crack-control element and the design crack width limit :
| Element | = 0.1 mm | = 0.2 mm | = 0.3 mm |
|---|---|---|---|
| Bonded tendons | 120 MPa | 185 MPa | 210 MPa |
| 10–12 mm bars | 160 MPa | 240 MPa | 280 MPa |
| 16 mm bars | 130 MPa | 200 MPa | 240 MPa |
The decompression load fraction — the ratio of the decompression moment to the governing service moment — is computed automatically from the prestress geometry.
Results
When tendons are present, the Crack Width panel displays a Cl. 8.6.3 crack control design check card showing:
- Concrete tensile stress compared to and
- Steel-stress increment and the Table 8.6.3 limit for the governing element
- Utilisation = OK, with the satisfied route name as the result label
PT crack control — EN 1992-1-1 (Cl. 7.3.1, Table 7.1N)
For sections designed to EN 1992-1-1, crack control for prestressed members follows Cl. 7.3.1(6) and the associated National Annex table. The approach differs from AS 3600’s deemed-to-comply ladder: EN 1992 specifies a maximum crack width per exposure class and relies on the general RC crack width formula (Cl. 7.3.4) for sections that are permitted to crack, while decompression replaces the crack width limit for the most aggressive exposure classes.
Exposure class limits (Table 7.1N): Under the quasi-permanent load combination:
| Exposure class | Criterion |
|---|---|
| X0, XC1 | mm |
| XC2, XC3, XC4 | mm |
| XD1, XD2, XS1, XS2, XS3 | Decompression (no tensile stress at bonded tendons within 100 mm of the exposed face) |
Decompression check: ACS verifies that every fibre in the critical zone (within 100 mm of the exposed face) remains in compression () under the quasi-permanent combination. When the decompression criterion is not met, the exposure class is violated — there is no fall-back to a crack width limit for XD/XS sections.
Tendon stress increment (Cl. 7.3.4): For bonded post-tensioned sections remaining uncracked under the characteristic load combination, ACS additionally checks that the stress increment in the prestressing steel above the decompression state does not exceed the nationally determined limit (default 200 MPa for post-tensioned, 150 MPa for pre-tensioned). See Section analysis — EN 1992-1-1 crack control for prestressed members for full formulation.
Cracked regime scope: EN 1992-1-1 crack width calculation for cracked prestressed sections (where the quasi-permanent combination places the cross-section in tension) requires combining bonded tendon area with conventional bar area in the expression (Cl. 7.3.4(3)). ACS currently implements this combined-area path for sections with bonded tendons plus supplementary reinforcement. Sections with unbonded tendons or complex duct configurations may produce conservative results pending refinement — these are noted in the results panel.
PT ultimate capacity
The ultimate moment capacity of a prestressed section accounts for the increase in tendon stress beyond the effective prestress as the section deforms toward failure. ACS uses the effective (post-loss) prestress as the starting point for all ultimate capacity calculations — both in the live results panel and in generated PDF reports. The initial jacking stress is never used as a substitute.
The capacity itself is reported on the ULS tab, as / — the same pure-bending solve, prestress-aware, that a reinforced section uses. The PT tab reports only , the tendon stress at that ultimate. There is one capacity engine, so the two tabs cannot disagree.
Where:
- = effective prestress after all losses (not the jacking stress )
- = additional strain at the tendon level at ultimate
- = ultimate tensile strength of the strand (1860 MPa for standard strands)
Bonded tendons
For bonded tendons, strain compatibility applies — the tendon strain increases with the surrounding concrete strain, providing a significant stress increase at ultimate. The tendon stress at ultimate is computed from the full nonlinear strain profile up to the code-specified limiting concrete strain.
Unbonded tendons
For unbonded tendons, the tendon is free to slide within the duct, so the stress increase is limited. AS 3600 Cl. 8.1.8 provides two simplified formulae depending on the span-to-depth ratio of the member:
Item (a) — span/depth ratio ≤ 35 (compact members):
Item (b) — span/depth ratio > 35 (slender members):
In both cases is additionally capped at (the tendon yield stress).
Where:
- = effective prestress after all losses (MPa)
- = characteristic compressive strength of concrete (MPa)
- = tendon reinforcement ratio ()
Enter the member span-to-depth ratio in the Applied Loads panel. ACS automatically selects Item (a) or Item (b) based on this value. For span/depth > 35 the Item (b) cap of MPa is significantly lower than the Item (a) cap of MPa — using an incorrect branch overstates the ultimate capacity of slender post-tensioned members.
Results
The PT tab reports the tendon stress; the ultimate capacity itself is on the ULS tab, as / . Both come from the same strain-compatibility solve, so the two tabs cannot disagree.
| Output | Tab | Description | Units |
|---|---|---|---|
| Tendon stress | PT | Final stress in the tendon at ultimate | MPa |
| Unbonded formula | PT | Item (a) or Item (b) applied, based on the span/depth ratio | — |
| ULS | Nominal ultimate moment capacity in pure bending | kN.m | |
| ULS | Design capacity (with strength reduction factor) | kN.m | |
| Neutral axis depth | ULS | Depth of compression zone at ultimate | mm |
| Ductility check | ULS | Pass/fail against code ductility limits | — |
Tips and best practices
- Verify that does not exceed 0.85 (AS 3600 Cl. 3.4.2) or 0.80 (ACI 318) — exceeding these limits risks strand relaxation or rupture during jacking
- If transfer stresses exceed allowable limits, consider debonding some strands near the ends or raising
- For post-tensioned members, place the tendon at the location of maximum eccentricity (typically near the bottom at midspan)
- Check that the effective prestress provides sufficient precompression to raise the cracking moment above the maximum service moment — cross-reference the PT cracking moment result with the SLS stress check
- For slender post-tensioned slabs (span/depth > 35), the Item (b) formula applies and the achievable tendon stress at ultimate is lower; ensure the capacity check accounts for this
- The bond type significantly affects ultimate capacity: bonded tendons develop higher stresses at ultimate than unbonded tendons
- The default per AS 3600 Cl. 3.3.1(b)(iii) is intentionally conservative; if certified test data shows a higher yield stress, use a custom strand type
- The moment-curvature (M-) curve and interaction diagram both incorporate the tendon prestrain — the cracking point on the M- curve equals from the PT cracking moment panel
- Use flat ducts for slab-band tendons with 1–5 strands; the wider footprint lowers the required cover relative to a round duct of equivalent area, and ACS uses the actual flat-duct width in the Cl. 8.2.1.5 shear deduction
- For crack control on PT slabs, the Cl. 8.6.3 decompression route often governs; if the decompression check fails, adding slightly more prestress (or reducing the service moment) typically brings the section into compliance without changing the reinforcement layout
- Review the Δσ_p column in the time-dependent panel alongside the losses breakdown — the two analyses use independent paths and should be compared to confirm consistent loss estimates
Related pages
- Reinforcement — placing tendons in the section
- Section analysis — overview of all analysis types
- Time-dependent effects — creep and shrinkage analysis
- RC beam example — worked example (reinforced, not prestressed)