
Getting started with the Section Analyzer
Walk through your first Section Analyzer run — create a tool instance, draw a rectangular outline, assign a material, read the section properties, and generate a report.
What you will learn
In this guide, you will:
- Add a Section Analyzer instance to a project
- Draw a rectangular outline on the canvas
- Assign a material from the picker
- Run the backend calculation and read the section properties
- Generate a PDF report
By the end, you will have a working analysis you can extend with voids, inclusions, and additional materials. For definitions of the section properties you will encounter, see the glossary.
Before you start
You need:
- An Integraph account
- A project (create one from the Projects Dashboard if you do not have one yet)
Step 1: Add a Section Analyzer to your project
Open your project from the Projects Dashboard, click New Design, and select GCS (General Cross Section) from the tool catalogue. Give it a descriptive name — for example, “Web stiffener cross-section” — and click Create. The tool instance appears in your project’s design grid; click it to open the editor.
The editor opens with an empty canvas. The right sidebar shows the Section Properties panel (empty for now); the left panel shows the Geometry tab with an empty element list.
Step 2: Draw a rectangular outline
The drawing toolbar floats at the bottom-centre of the canvas. It has two modes:
- Select (V) — click elements and vertices to select, drag to pan
- Draw Polygon (P) — click to place vertices, click the start vertex to close
Press P (or click the pen-tool icon) to switch into draw mode. Then:
- Click anywhere on the canvas to place the first vertex
- Hold SHIFT to lock horizontal/vertical movement, type
100and press Enter to place the next vertex 100 mm to the right - With SHIFT still held, type
50and press Enter to place a vertex 50 mm up - Type
100, Enter to come back left - Click the starting vertex to close the rectangle
The four-vertex outline now appears in the Elements list on the left and on the canvas as a closed polygon.
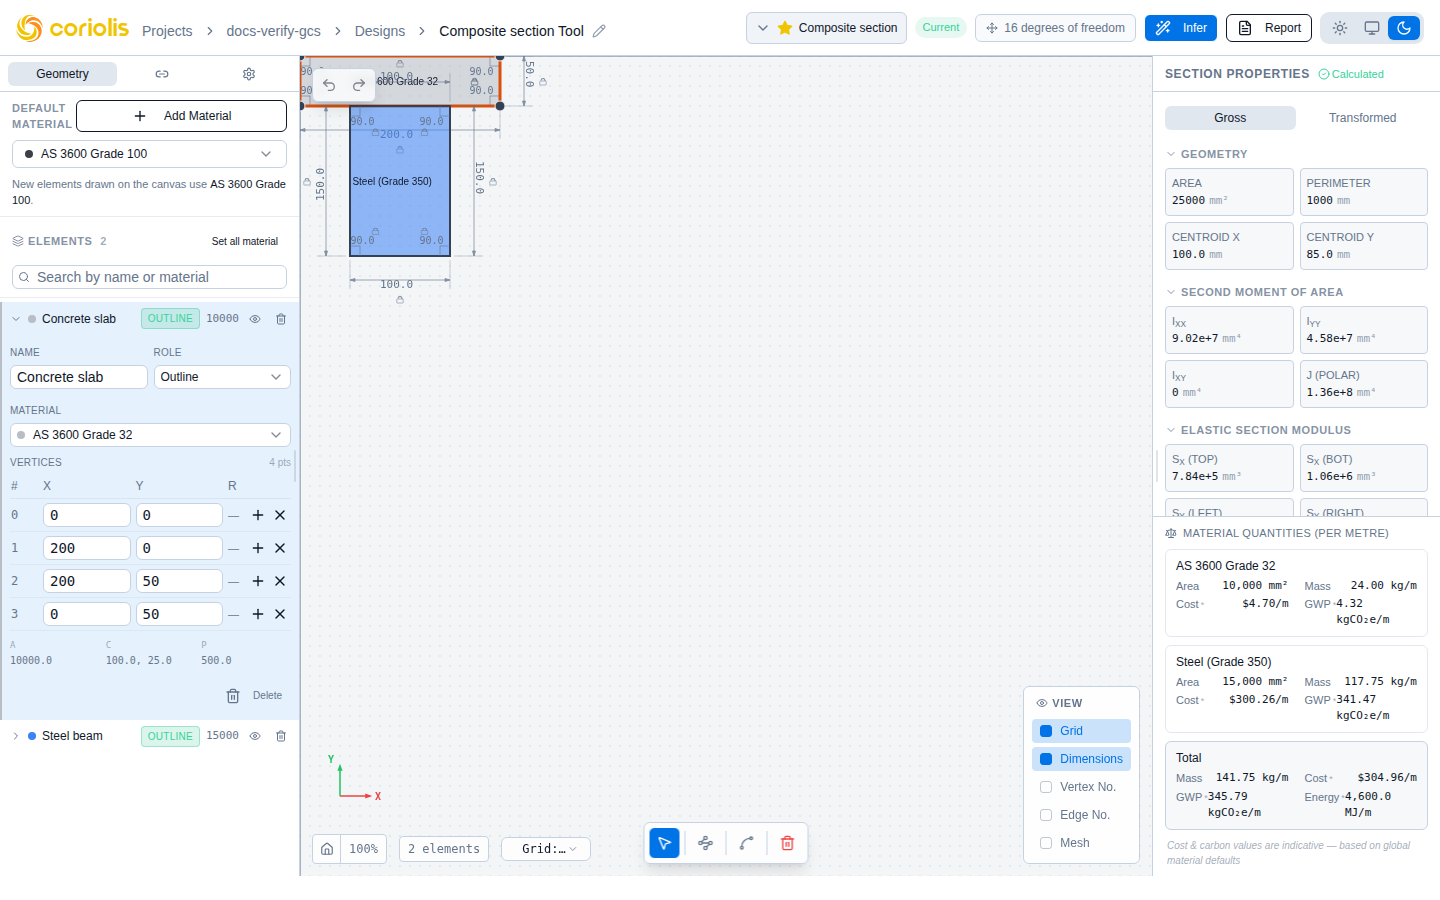
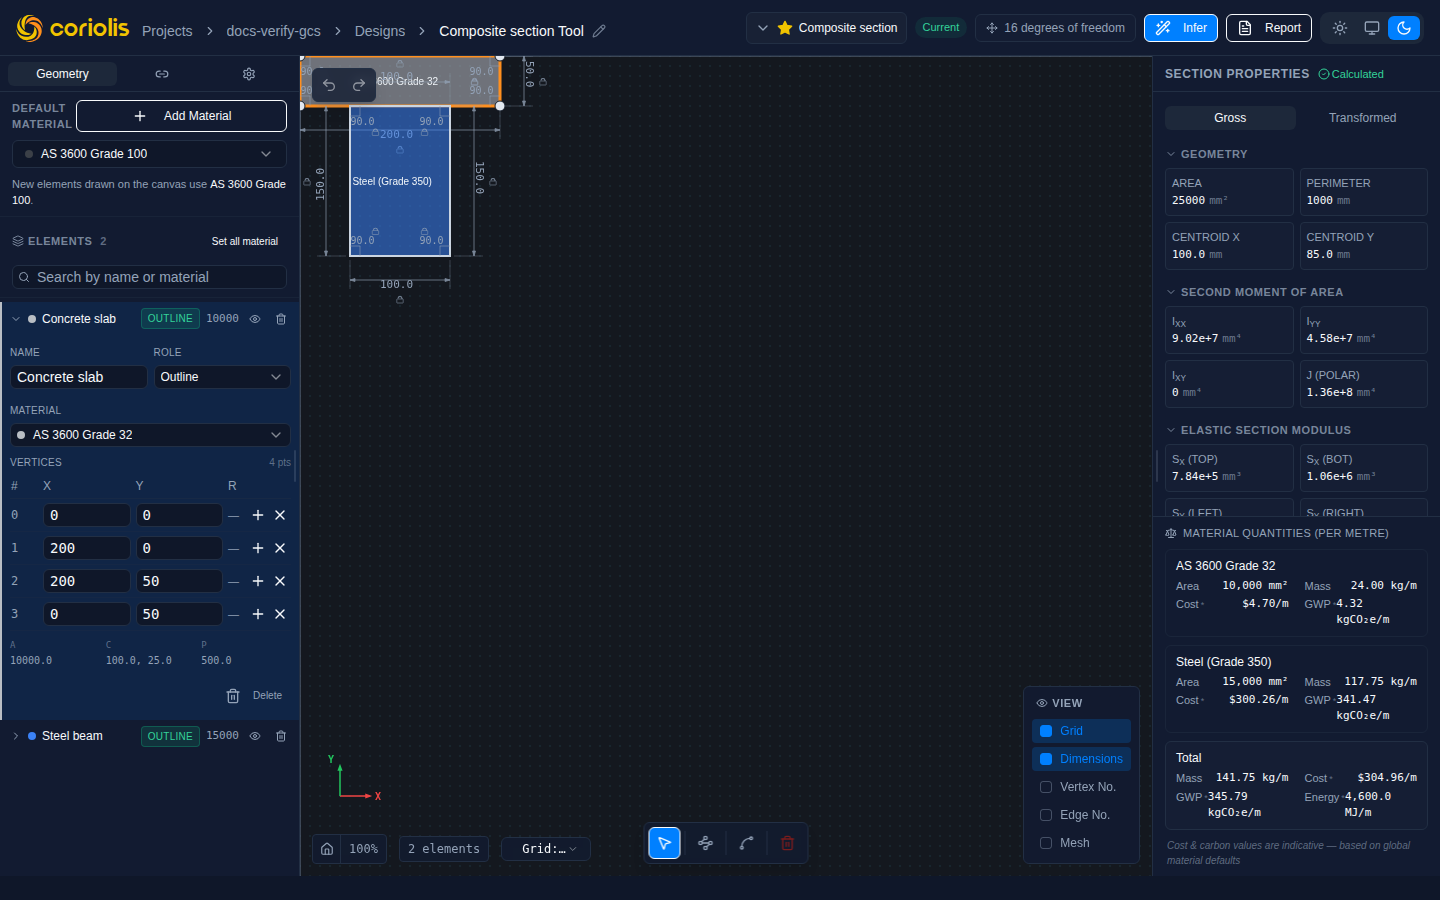
The right sidebar populates with Preview properties immediately — area, perimeter, centroid, second moments, elastic moduli, plastic moduli, radii of gyration. These are computed in the browser for instant feedback. The badge says Preview because no authoritative backend run has happened yet.
Step 3: Assign a material
Open the Geometry tab on the left panel if it isn’t already active. Each row in the Elements list has a material picker. The Section Analyzer is family-agnostic — the picker returns every material your project’s jurisdiction supports (steel, concrete, timber, masonry, …), not just steel or just concrete. This is deliberate: you might be analysing a composite section, or your section might be purely geometric (a placeholder material is fine if you only care about area and inertia).
Open the picker for your rectangle row and select a material — any material valid for the jurisdiction will do. For a worked composite example later, see Worked example: composite section.
Step 4: Read the section properties
As soon as the geometry validates server-side the section properties panel populates and the Preview badge flips to a green Calculated badge. There is nothing to click — the calculation runs automatically once the regions are valid.
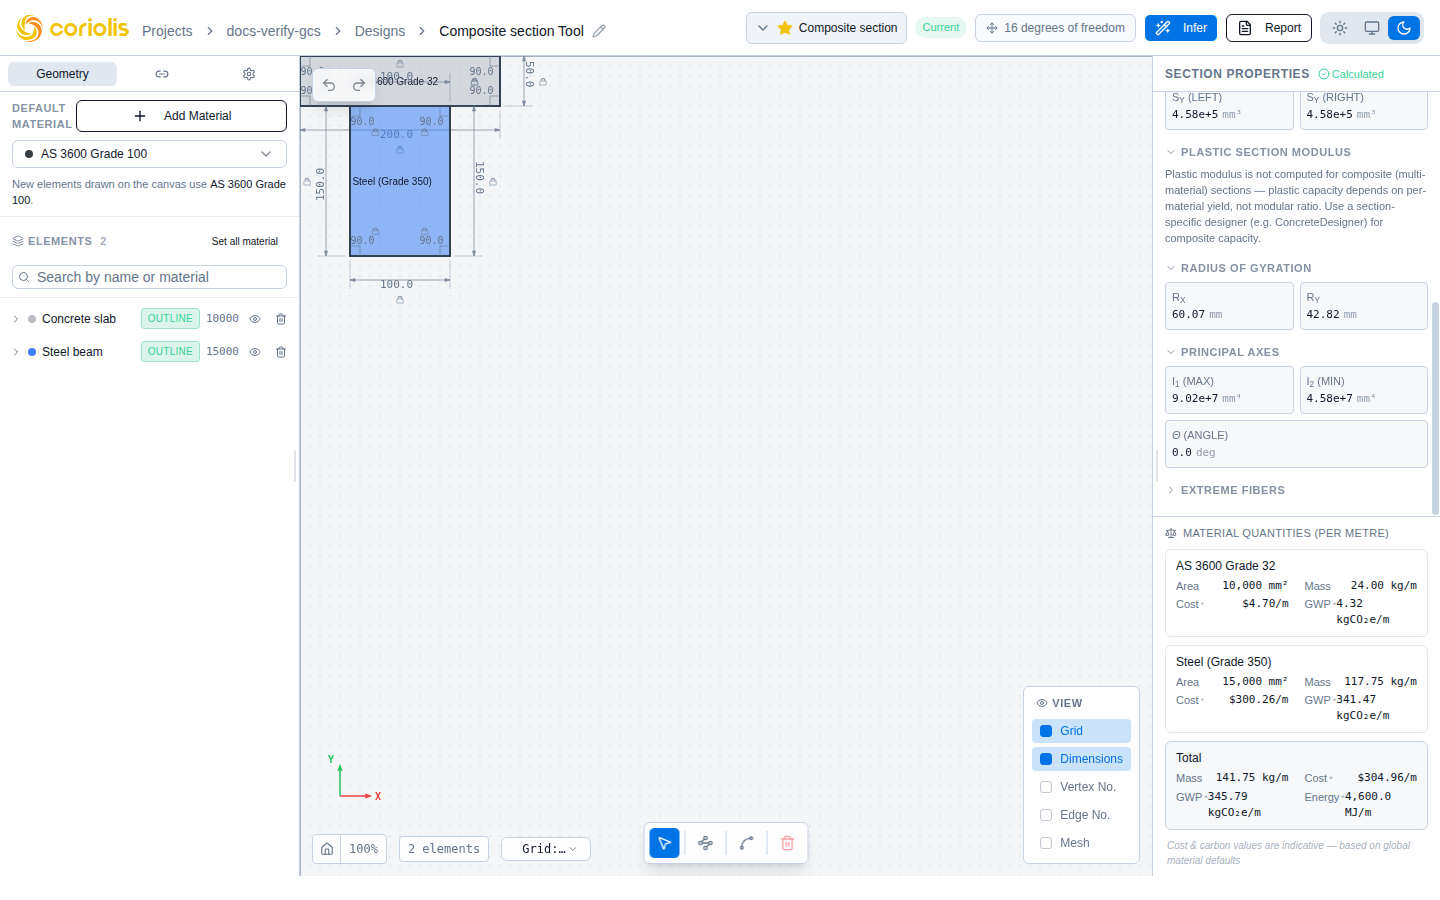
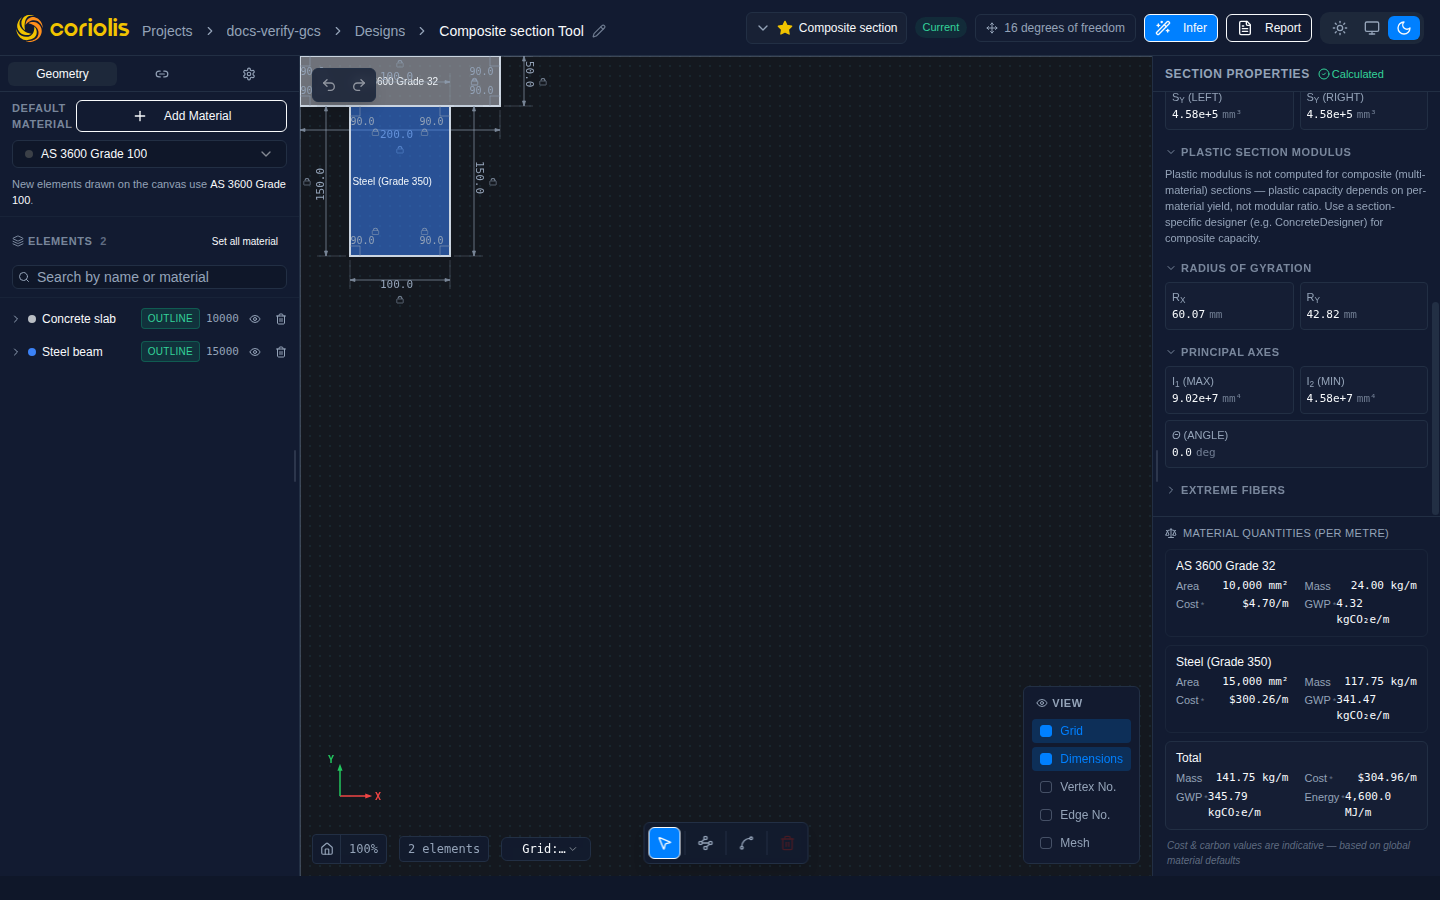
For a 100 × 50 mm rectangle you should see:
- Area = 5,000 mm²
- Perimeter = 300 mm
- Centroid = (50, 25) mm (the geometric centre of the rectangle)
- = = 100 × 50³ / 12 ≈ 1.04 × 10⁶ mm⁴
- = = 50 × 100³ / 12 ≈ 4.17 × 10⁶ mm⁴
- = 100 × 50² / 4 = 62,500 mm³ (plastic modulus)
- Shape factor = = 1.5 (the textbook value for a rectangle)
Hand-check the area and centroid against the dimensions of your rectangle — if they do not match, your polygon was drawn in different units or with a different origin than you expected.
If the validator rejects the geometry (for example, the polygon self-intersects because two vertices were placed in the wrong order) you will see an error banner in the sidebar with a specific error code: self_intersection, void_outside_outline, overlapping_regions, no_outline, insufficient_vertices, or non_finite_coordinate. Fix the geometry and re-run.
Step 5: Generate a report
Click the Report button in the top action bar (it has a Document icon). The tool generates a PDF report containing the geometry preview, all property values, and a brief computation summary. The report uses the same backend results that populate the sidebar — there is no second computation path, so the report cannot disagree with the UI (see #874 for why this matters).
Where to go next
- Drawing tools — the full set of geometry input options, including distance and angle locks, vertex editing, and multi-region geometry
- Materials — material assignment in detail, including composite sections and the modular-ratio method
- Section properties — every output field with its formula, units, and standard reference
- Worked example: composite section — a rectangle with a void and a steel inclusion, walking through transformed properties